This test is run by .
Note that your final mark will not be saved in the system.
Note that your final mark will not be saved in the system.
Venn Diagrams Typeit
Target Level
4-6
Running Total
0
0%
Attempt
1 of 3
Type the correct answers into the spaces. Fill all the spaces before clicking ‘Check Answers!’
There are 25 students in a class.
13 students like apples.
17 students like bananas.
7 students like apples and bananas.
13 students like apples.
17 students like bananas.
7 students like apples and bananas.
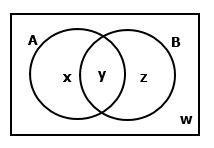
- State which numbers would complete the Venn diagram above, where A and B represent students who like apples and students who like bananas, respectively.
w = , x = , y = , z = - What is the probability that a student in the class doesn’t like apples, given that they like bananas? Give your answer as a decimal to 3 significant figures.