This test is run by .
Note that your final mark will not be saved in the system.
Note that your final mark will not be saved in the system.
Sets and Venn Diagrams Typeit
Target Level
C
Running Total
0
0%
Attempt
1 of 3
Type the correct answers into the spaces. Fill all the spaces before clicking ‘Check Answers!’
There are 25 students in a class.
13 students like apples.
17 students like bananas.
7 students like apples and bananas.
13 students like apples.
17 students like bananas.
7 students like apples and bananas.
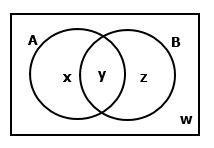
- State which numbers would complete the Venn diagram above, where A and B represent students who like apples and students who like bananas, respectively.
w = , x = , y = , z = - What is the probability that a student in the class doesn’t like apples, given that they like bananas? Give your answer as a decimal to 3 significant figures.