This test is run by .
Note that your final mark will not be saved in the system.
Note that your final mark will not be saved in the system.
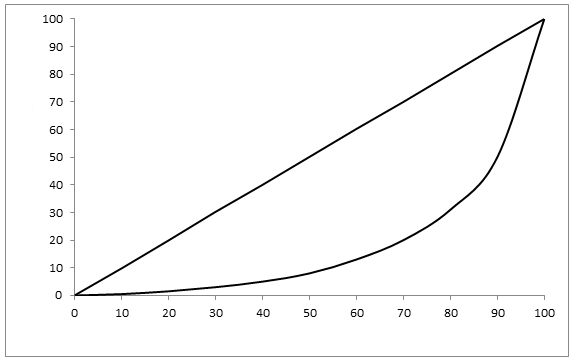
Income and wealth disparities Diagrams
Target Level
C
Running Total
0
0%
Attempt
1 of 3
Click on a top label, then click on its correct position on the diagram. Or, drag a top label and drop it onto the correct position. Position all the labels before clicking ‘Check’.
Gini coefficient
Unequal country
Cumulative percentage of income
Perfect Equality
Cumulative percentage of population