This test is run by .
Note that your final mark will not be saved in the system.
Note that your final mark will not be saved in the system.
Why does quality of life vary so much within one megacity? [Case Study] Pindrop
Target Level
4-5
Running Total
0
0%
Attempt
1 of 3
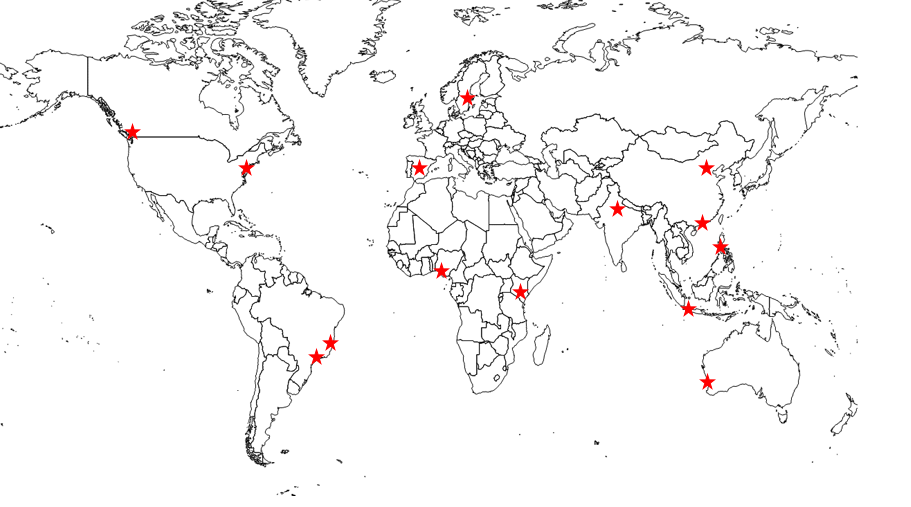
Click on a top label, then click on its correct position on the diagram. Or, drag a top label and drop it onto the correct position. Position all the labels before clicking ‘Check’.
Stockholm
New Delhi
New York
Perth
Beijing
Jakarta
Rio de Janeiro
Vancouver
Sao Paulo
Lagos
Madrid
Nairobi
Manila
Hong Kong