This test is run by .
Note that your final mark will not be saved in the system.
Note that your final mark will not be saved in the system.
Venn Diagrams Diagnose
Target Level
4-6
Running Total
0
0%
Attempt
1 of 1
Venn Diagrams
There are 30 students in a class.
17 students like apples.
12 students like bananas.
3 students like apples and bananas.
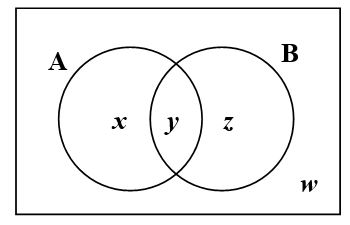
a) State which numbers would complete the Venn diagram above, where A and B represent students who like apples and students who like bananas, respectively.
w = , x = , y = , z =
b) What is the probability that a student in the class likes apples, given that they like bananas? Type your answer without spaces. Make sure you use forward slash (x/y) for a fraction.