This test is run by .
Note that your final mark will not be saved in the system.
Note that your final mark will not be saved in the system.
Distance-Time & Velocity-Time Graphs Diagnose
Target Level
4-6
Running Total
0
0%
Attempt
1 of 1
Distance-Time & Velocity-Time Graphs
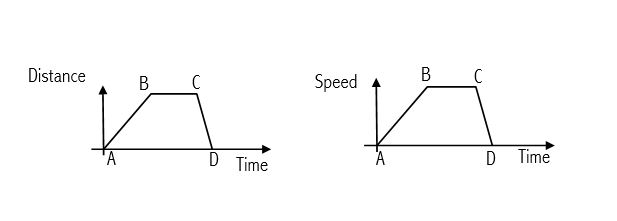
a) Vishal’s journey is represented by the graph on the left above.
i) When is Vishal stationary (stopped)? Give your answers in alphabetical order. Between and
ii) When is he moving fastest? Give your answers in alphabetical order. Between and
iii) What does the gradient of the graph on the left represent?
b) i) The graph on the right above represents the journey of an object. What does the gradient of AB represent?
ii) What does the area ABCD in the graph on the right above represent?
iii) What is happening between B and C in the graph on the right above?