This test is run by .
Note that your final mark will not be saved in the system.
Note that your final mark will not be saved in the system.
Sets and Venn Diagrams Diagnose
Target Level
C
Running Total
0
0%
Attempt
1 of 1
Sets and Venn Diagrams
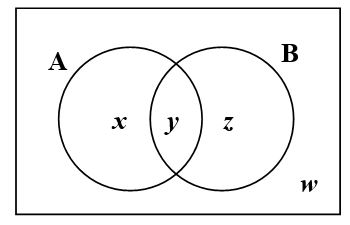
There are 30 students in a class.
17 students like apples.
12 students like bananas.
3 students like apples and bananas.
a) State which numbers would complete the Venn diagram above, where A and B represent students who like apples and students who like bananas, respectively.
w = , x = , y = , z =
b) What is the probability that a student in the class likes apples, given that they like bananas? Type your answer without spaces. Make sure you use forward slash (x/y) for a fraction.